Your top news on energy
Provided by AGPTaseko Announces Continued Strong Operational and Financial Results in the First Quarter 2026
VANCOUVER, British Columbia, May 06, 2026 (GLOBE NEWSWIRE) -- Taseko Mines Limited (TSX: TKO; NYSE American: TGB; LSE: TKO) ("Taseko" or the "Company") reports first quarter 2026 Adjusted EBITDA* of $93 million and Earnings from mining operations before depletion and amortization and non-recurring items* of $115 million, a 172% and 195% improvement over the same period in 2025, respectively. Revenues in the first quarter were $237 million from the sale of 27 million pounds of copper and 708 thousand pounds of molybdenum. First quarter net income was $17 million ($0.05 per share) and Adjusted net income* was $28 million ($0.08 per share).
As previously released, Gibraltar produced 30 million pounds of copper and 717 thousand pounds of molybdenum in the first quarter, at Total operating cost (C1)* of US$2.63 per pound of copper produced. The strong production levels from the second half of 2025 continued in the first quarter and copper grades of 0.25% were in line with the life of mine average. Mill throughput was 7.0 million tons in the first quarter, slightly lower than the previous quarter. Throughput was adjusted to optimize copper recoveries, which increased to 83% in the quarter, and was also impacted by unscheduled maintenance. Tons mined in the first quarter were in line with plan.
At Florence Copper, the injection of solutions in the wellfield commenced in late 2025 in parallel with the SX/EW plant commissioning. Initial flowrates were above expectations resulting in faster acidification of the wellfield, and solution grades reached targeted levels in January. The SX/EW plant commenced operation in February, and first copper cathodes were harvested at the end of February. A total of 1.5 million pounds of copper cathode was produced in the first quarter. Five drill rigs are now operating on site and increased production from newly acidified wells is expected later in the second quarter. Additional production growth will come as new groups of wells are constructed, tested, and integrated into the wellfield operation over the remainder of the year. Expected copper cathode production in 2026 continues to be in the range of 30 to 35 million pounds.
Stuart McDonald, President & CEO of Taseko, commented, “Both of Taseko’s producing assets performed well in the first quarter. Gibraltar operations have achieved a consistent production level in recent quarters as mining activities have been advancing on plan in the Connector pit.”
“At Florence Copper, we are very pleased with the first six months of wellfield operations and first two months of plant operations. After the initial cathode harvest at the end of February, our operating team has done an excellent job stabilizing solution flow and grade from the wellfield through to the SX/EW plant circuits. Copper production from the initial wells has achieved a steady rate, in line with our expectations, and the focus is now on expanding the wellfield to ramp-up production over the remainder of the year.”
“Environmental assessment work on our Yellowhead copper project continued to advance in the quarter. After the first round of community open houses that we held last fall, our next significant milestone is filing the detailed project description, which will incorporate feedback received from the general public, Indigenous communities, and regulatory agencies. We are working on this now with the goal to file it this coming summer.”
“Taseko is uniquely positioned as a North American copper growth story. Florence Copper is adding low-cost production and cash flow growth this year, to Gibraltar’s existing production base. The Company is well positioned to capitalize on the strong copper markets we see today, and continue to unlock value from our pipeline of large-scale longer term projects.”
*Non-GAAP performance measure. See end of news release.
First Quarter Review
- Earnings from mining operations before depletion and amortization* was $114.6 million, Adjusted EBITDA* was $93.5 million and cash flow from operations was $93.9 million;
- Net income was $16.8 million ($0.05 earnings per share) and Adjusted net income* was $27.5 million ($0.08 adjusted earnings per share);
- Gibraltar produced 30.0 million pounds of copper, including 0.7 million pounds of copper cathode, at a total operating cost (C1)* of US$2.63 per pound of copper produced. Copper head grades averaged 0.25% and recoveries averaged 83%;
- Gibraltar sold 27.0 million pounds of copper, including 0.9 million pounds of copper cathode, at an average realized copper price of US$5.74 per pound contributing to revenues of $237.1 million for Taseko. The Company had copper collar contracts maturing in the first quarter for 27 million pounds with a ceiling price of US$5.40 per pound, resulting in a realized derivative loss of $17.4 million;
- Site costs increased in the quarter compared to 2025 as a result of higher diesel and explosive costs which could remain elevated in the coming quarters due to market factors;
- Florence Copper’s SX/EW plant started up in mid-February and first copper cathodes were harvested at the end of February. A total of 1.5 million pounds of copper cathode was produced in the last five weeks of the quarter. Ongoing drilling and expansion of the wellfield will continue in 2026 to support the ramp up of copper production at Florence; and
- At March 31, 2026, the Company had a cash balance of $169 million and total available liquidity of $322 million including its undrawn corporate revolving credit facility.
| Three months ended March 31, |
||||
| Gibraltar operating data | 2026 | 2025 | Change | |
| Tons mined (millions) | 24.2 | 23.2 | 1.0 | |
| Tons milled (millions) | 7.0 | 7.9 | (0.9 | ) |
| Production (million pounds Cu) | 30.0 | 20.0 | 10.0 | |
| Sales (million pounds Cu) | 27.0 | 21.8 | 5.2 | |
| Financial data | Three months ended March 31, |
|||
| (Cdn$ in thousands, except per share amounts) | 2026 | 2025 | Change | |
| Revenues | 237,093 | 139,149 | 97,944 | |
| Cash flows from operations | 93,857 | 55,892 | 37,965 | |
| Net income (loss) | 16,844 | (28,560 | ) | 45,404 |
| Per share - Basic (“EPS”) | 0.05 | (0.09 | ) | 0.14 |
| Earnings from mining operations before depletion, amortization and non-recurring items* | 114,561 | 38,791 | 75,770 | |
| Adjusted EBITDA* | 93,463 | 34,391 | 59,072 | |
| Adjusted net income (loss)* | 27,535 | (6,943 | ) | 34,478 |
| Per share - Basic (“Adjusted EPS”)* | 0.08 | (0.02 | ) | 0.10 |
*Non-GAAP performance measure. See end of news release.
Review of Operations
Gibraltar
| Operating data | Q1 2026 | Q4 2025 | Q3 2025 | Q2 2025 | Q1 2025 | ||||||||||
| Tons mined (millions) | 24.2 | 28.0 | 29.3 | 30.4 | 23.2 | ||||||||||
| Tons milled (millions) | 7.0 | 7.2 | 7.8 | 7.7 | 7.9 | ||||||||||
| Strip ratio | 2.6 | 2.2 | 1.5 | 2.3 | 4.6 | ||||||||||
| Site operating cost per ton milled* | $ | 18.15 | $ | 16.61 | $ | 14.98 | $ | 11.23 | $ | 8.73 | |||||
| Copper concentrate | |||||||||||||||
| Head grade (%) | 0.25 | 0.26 | 0.22 | 0.20 | 0.19 | ||||||||||
| Recovery (%) | 82.6 | 80.9 | 77.2 | 63.2 | 67.5 | ||||||||||
| Production (million pounds Cu) | 29.2 | 29.8 | 26.7 | 19.4 | 20.0 | ||||||||||
| Sales (million pounds Cu) | 26.0 | 30.8 | 25.4 | 19.0 | 21.8 | ||||||||||
| Inventory (million pounds Cu) | 5.9 | 2.9 | 4.0 | 2.7 | 2.3 | ||||||||||
| Copper cathode | |||||||||||||||
| Production (thousand pounds Cu) | 733 | 919 | 895 | 395 | - | ||||||||||
| Sales (thousand pounds Cu) | 938 | 783 | 905 | - | - | ||||||||||
| Molybdenum concentrate | |||||||||||||||
| Production (thousand pounds Mo) | 717 | 830 | 558 | 180 | 336 | ||||||||||
| Sales (thousand pounds Mo) | 708 | 953 | 421 | 178 | 364 | ||||||||||
| Per unit data (US$ per Cu pound produced)1 | |||||||||||||||
| Site operating cost* | $ | 3.09 | $ | 2.80 | $ | 3.09 | $ | 3.15 | $ | 2.41 | |||||
| By-product credit* | (0.62 | ) | (0.59 | ) | (0.39 | ) | (0.19 | ) | (0.33 | ) | |||||
| Site operating cost, net of by-product credit* | 2.47 | 2.21 | 2.70 | 2.96 | 2.08 | ||||||||||
| Off-property cost* | 0.16 | 0.26 | 0.17 | 0.18 | 0.18 | ||||||||||
| Total operating cost (C1)* | $ | 2.63 | $ | 2.47 | $ | 2.87 | $ | 3.14 | $ | 2.26 | |||||
1 Copper pounds produced includes copper in concentrate and copper cathode.
Operations Analysis
First Quarter Results of Gibraltar
Gibraltar copper production totaled 30.0 million pounds in the quarter, including 0.7 million pounds of copper cathode, which was comparable to the previous quarter and a 50% increase from the comparative prior year quarter. Gibraltar’s cathode production benefited from the SX/EW plant operating continuously through the winter months.
Copper head grades averaged 0.25% and were in line with life of mine average grades. Copper recoveries averaged 83% and benefitted from improved ore characteristics. Copper sales in the first quarter were 27.0 million pounds, and lower than production due to shipment timing.
Mill throughput was 7.0 million tons in the first quarter, impacted by lower mill availability due to maintenance activities and ore hardness.
*Non-GAAP performance measure. See end of news release.
Operations Analysis - continued
A total of 24.2 million tons were mined in the first quarter, comparable to the comparative prior year quarter. The average strip ratio was 2.6 in the quarter, reflecting continued advancement of waste stripping for the next phases of the Connector pit.
Total Gibraltar site costs* were $142.2 million (including capitalized stripping of $15.2 million) in the first quarter reflecting higher costs for key inputs and unscheduled maintenance activities. Diesel costs increased $5.3 million compared to the comparative prior year quarter, driven by both higher usage and increased diesel prices in March as a result of rising oil prices due to the ongoing conflict in the Middle East. Explosives costs also increased $6.1 million compared to the comparative prior year quarter, driven by higher usage and higher costs caused by a disruption in the supply chain. Site costs were also higher due to unscheduled maintenance activities, primarily on the loader and dozer fleets.
Molybdenum production was 717 thousand pounds in the first quarter and reflects the higher molybdenum grades realized in Connector pit ore. At an average molybdenum price of US$25.73 per pound for the quarter, molybdenum provided a by-product credit of US$0.62 per pound of copper produced.
Off-property costs were US$0.16 per pound of copper produced and reflect the lower treatment and refining charges (“TCRC”) realized on Gibraltar’s favorable offtake contracts.
Total operating costs (C1)* were US$2.63 per pound of copper produced for the first quarter, compared to US$2.47 per pound of copper produced for the prior quarter, driven by higher repairs and maintenance costs and higher costs for key inputs, particularly diesel and explosives, partially offset by higher capitalized stripping costs and lower offsite costs.
Gibraltar Outlook
Mining activity is focused in the Connector pit, which will be the primary source of ore for the next three years (2026 through 2028). Total copper production at Gibraltar for 2026 is expected to be in the range of 110 to 115 million pounds and is expected to continue at similar levels (± 5%) until completion of mining in the Connector pit. This includes the expected impact of supergene ore on mill recoveries as well as a more conservative forecast for head grade based on mining experience to-date in the Connector pit.
*Non-GAAP performance measure. See end of news release.
Gibraltar Outlook - continued
Oxide ore mined from Connector Pit has been stacked on leach pads and will be processed in the Gibraltar SX/EW plant in the coming years. The second oxide leach pad is now being integrated into the operation, which is expected to increase flow rates to the SX/EW plant, and support higher copper cathode production going forward.
Site diesel prices are currently $0.50 per litre higher than February levels. At these higher prices, Gibraltar’s operating costs will increase by approximately US$0.15 per pound in future quarters if these market conditions prevail.
Molybdenum production in 2026 is expected to remain at similar levels to 2025, and with molybdenum prices above US$25.00 per pound, we continue to expect strong molybdenum by-product credits.
The Company has offtake agreements covering substantially all of Gibraltar’s copper concentrate production for 2026, which contain low and in certain cases negative TCRC rates reflecting the continued tight copper smelting market. Based on the contract terms, the Company expects TCRCs to be nominal in 2026, similar to 2025. Spot TCRC rates continue to be attractive and the Company could tender additional 2027 tons in the coming months to take advantage of the favorable market.
The Company has a prudent hedging program in place to protect a minimum copper price and Gibraltar cash flow during the ramp-up of commercial operations at Florence Copper. Currently, the Company has copper collar contracts in place with a floor of US$4.00 per pound and a ceiling of US$5.40 per pound for 27 million pounds of copper production for the second quarter of 2026, and a floor of US$4.75 per pound and a ceiling of between US$7.50 and US$8.50 per pound for 24 million pounds of copper production for the third quarter of 2026 (refer to “Financial Condition Review—Hedging Strategy” for details). The Company has not hedged any of its Florence Copper production.
Florence Copper
Florence Copper is an in-situ copper recovery operation, located in Arizona, USA, that produces LME Grade A copper metal without conventional open-pit mining methods or major surface disturbance. Florence Copper is projected to rank among the lowest greenhouse gas (“GHG”) intensity primary copper producers in North America, delivering environmentally responsible copper to North American manufacturers and consumers. The commercial operations at Florence Copper have an annual production capacity of 85 million pounds of copper and with current reserves has a current mine life of 22 years. Florence Copper is expected to be in the lowest quartile of primary producers on the global copper cost curve based on its long-term operating parameters once at full production capacity.
Construction activities at Florence Copper were substantially complete in the fourth quarter of 2025.
The focus of the operating team in the first quarter transitioned to wellfield operations, commissioning of the SX/EW plant and the start of production. Commercial wellfield acidification commenced in November with initial injection flowrates slightly above expectations. Commissioning of the SX/EW plant area advanced in parallel with initial wellfield operations, and plant operations commenced mid-February. Plating of copper cathode commenced with the startup of the electrowinning circuit and first cathodes were harvested at the end of February.
Florence Copper - continued
Wellfield drilling re-commenced in late 2025 and there are currently five drill rigs operating on site. Continued expansion of the commercial wellfield will be required to support higher solution flows and increased copper production as the Florence Copper commercial operation progresses through its ramp up in 2026.
Total production in 2026 at Florence Copper is expected to be in the range of 30 to 35 million pounds of copper. In the first quarter, with the SX/EW plant operating, Florence Copper produced a total of 1.5 million pounds of LME Grade A copper cathode with corresponding sales of 619 thousand pounds.
Florence Copper has a fixed price contract in place for all sulphuric acid requirements for 2026, so there is no expected near-term impact from reported disruptions in global acid supply chains due to geopolitical events in the Middle East.
|
Florence Copper site costs (US$ in thousands) |
Three months ended March 31, 2026 |
| Commissioning and start-up costs | 15,175 |
| Wellfield development capital expenditures | 13,075 |
| Site operating costs | 7,414 |
| Total site costs | 35,664 |
Long-term Growth Strategy
Taseko’s strategy has been to grow the Company by acquiring and developing a pipeline of projects focused on copper in North America. We continue to believe this will generate long-term returns for shareholders. Our other development projects are located in BC, Canada.
Yellowhead copper project
In July 2025, the Company published a new report titled “Technical Report Update on the Yellowhead Copper Project, British Columbia, Canada” (the “Yellowhead 2025 Technical Report”). Based on the Yellowhead 2025 Technical Report, the Yellowhead copper project is expected to produce 4.4 billion pounds of copper over a 25-year mine life at an average C1 cost, net of by-product credit, of US$1.90 per pound of copper produced. During the first 5 years of operation, the Yellowhead project is expected to produce an average of 206 million pounds of copper per year at an average C1 cost, net of by-product credit, of US$1.62 per pound of copper produced. The Yellowhead project also contains valuable precious metal by-products with 282,000 ounces of gold production and 19.4 million ounces of silver production over the life of mine.
The economic analysis in the Yellowhead 2025 Technical Report was prepared using a copper price of US$4.25 per pound, a gold price of US$2,400 per ounce, and a silver price of US$28.00 per ounce.
Project highlights based on the Yellowhead 2025 Technical Report are detailed below:
- Average annual copper production of 178 million pounds over a 25 year mine life at total cash costs (C1) of US$1.90 per pound of copper produced;
- Over the first 5 years of the mine life, copper grade is expected to average 0.32% producing an average of 206 million pounds of copper at total cash costs (C1) of US$1.62 per pound of copper produced;
Long-term Growth Strategy - continued
- Concentrator designed to process 90,000 tonnes per day of ore with an expected copper recovery of 90%, and produce a clean copper concentrate with payable gold and silver by-products;
- Conventional open pit mining with a low strip ratio of 1.4;
- After-tax net present value of $2.0 billion (8% after-tax discount rate) and after-tax internal rate of return of 21%;
- Initial capital costs of $2.0 billion with a payback period of 3.3 years; and
- Expected to be eligible for the Canadian federal Clean Technology Manufacturing Investment Tax Credit, with 30% (approximately $540 million) of eligible initial capital costs reimbursed in year 1 of operation.
In June 2025, the Yellowhead project’s Initial Project Description was filed and accepted by the British Columbia Environmental Assessment Office and Impact Assessment Agency of Canada, formally commencing the Environmental Assessment process.
The Company continued to advance the environmental assessment work on the Yellowhead project in the quarter. After the first round of community-based open houses that were held in the fall, the next significant milestone is filing the detailed project description, based on public, Indigenous and agency feedback. On April 29, 2026, the Government of BC announced that the Yellowhead copper project has been added to its list of priority major projects.
The Company continues to engage with project stakeholders to ensure that the development of the Yellowhead Project is in line with environmental and social expectations. The Company has a community office for the Yellowhead project to support ongoing engagement with local communities including First Nations.
New Prosperity copper-gold project
In June 2025, Taseko, the Tŝilhqot’in Nation and the Province of BC reached a historic agreement concerning the New Prosperity project (the “Teẑtan Biny Agreement”). The Teẑtan Biny Agreement ended litigation among the parties while providing certainty with respect to how the significant copper-gold resource at New Prosperity may be developed in the future.
As part of the Teẑtan Biny Agreement, Taseko contributed a 22.5% equity interest in the New Prosperity mineral tenures to a trust for the future benefit of the Tŝilhqot’in Nation. The trust will transfer the property interest to the Tŝilhqot’in Nation if and when it consents to a proposal to pursue mineral development in the project area. Taseko retains a majority interest (77.5%) in the New Prosperity mineral tenures and can divest some or all of its interest at any time, including to other mining companies that could advance a project with the consent of the Tŝilhqot’in Nation. However, Taseko has committed not to be the proponent (operator) of mineral exploration and development activities at New Prosperity, nor the owner of a future mine development. Taseko has also entered into a consent agreement with the Tŝilhqot’in Nation, whereby no mineral exploration or development activity can proceed in the New Prosperity project area without the free, prior and informed consent of the Tŝilhqot’in Nation. The Province of BC and the Tŝilhqot’in Nation have agreed to negotiate the process by which the consent of the Tŝilhqot’in Nation will be sought for any proposed mining project to proceed through an environmental assessment process and have also agreed to undertake a land-use planning process for the area of the mineral tenures and a broader area of land within Tŝilhqot’in territory.
Long-term Growth Strategy - continued
Aley niobium project
Environmental monitoring and product marketing initiatives on the Aley niobium project continue. The converter pilot test is ongoing to provide additional process data to support the design of commercial process facilities. In 2025, the Company produced on-spec ferro-niobium, and the process is now scaling up to provide product samples to support marketing initiatives. The Company is also conducting a scoping study to investigate the potential for Aley to produce high-purity niobium oxides to supply the emerging niobium-based battery technology market.
Harmony gold project
On July 12, 2021, Taseko announced that it had entered into an asset purchase agreement (the “Agreement”) to sell the Harmony Gold Project to JDS Gold Inc. ("JDS"), a newly incorporated company controlled by JDS Energy & Mining Inc. and affiliates. Under the terms of the Agreement, JDS became the owner and operator of the Harmony Gold Project, a high-grade development-stage gold project located on Graham Island in Haida Gwaii. Taseko retained a 15% carried interest in JDS and a 2% net smelter return royalty on the Project. Taseko also had the right to terminate the Agreement and revert to 100% ownership of Harmony in the event JDS did not achieve certain project development milestones and an IPO or other liquidity event within an agreed timeframe. The agreed timeframe was subsequently extended several times and, as the conditions were not met by the deadline, Taseko exercised its reversionary right to receive the mineral tenures back from JDS in late 2025. Taseko is in the process of negotiating and executing a new option agreement with JDS to advance the Harmony Gold Project.
|
Conference Call and Webcast The Company will host a telephone conference call and live webcast on Thursday, May 7, 2026, at 11:00 a.m. Eastern Time (8:00 a.m. Pacific) to discuss these results. After opening remarks by management, there will be a question and answer session open to analysts and investors. The conference call may be accessed by dialing 800-715-9871 toll free or 646-307-1963, using the access code 3266924. The webcast may be accessed at tasekomines.com/investors/events and will be archived until May 7, 2027 for later playback. |
For further information on Taseko, see the Company’s website at tasekomines.com or contact:
- Investor enquiries Brian Bergot, Vice President, Investor Relations – 778-373-4554
Stuart McDonald
President and CEO
Non-GAAP Performance Measures
This MD&A includes certain non-GAAP performance measures that do not have a standardized meaning prescribed by IFRS Accounting Standards. These measures may differ from those used by, and may not be comparable to such measures as reported by, other issuers. The Company believes that these measures are commonly used by certain investors, in conjunction with conventional IFRS Accounting Standards measures, to enhance their understanding of the Company’s performance. These measures have been derived from the Company’s financial statements and applied on a consistent basis. The following tables below provide a reconciliation of these non-GAAP measures to the most directly comparable IFRS Accounting Standards measures.
Gibraltar total operating cost and site operating cost, net of by-product credit
Total operating cost includes all costs absorbed into inventory, as well as transportation costs and insurance recoverable. Site operating cost is calculated by removing net changes in inventory, depletion and amortization, insurance recoverable, and transportation costs from cost of sales. Site operating cost, net of by-product credit is calculated by subtracting by-product credits from site operating cost. Site operating cost, net of by-product credit per pound is calculated by dividing the aggregate of the applicable costs by pounds of copper produced. Total operating cost per pound is the sum of site operating costs, net of by-product credits and off-property costs divided by pounds of copper produced. By-product credit is calculated based on actual sales of molybdenum (net of treatment costs), silver and gold during the period divided by the total pounds of copper produced during the period. These measures are calculated on a consistent basis for the periods presented.
|
Gibraltar (Cdn$ in thousands) |
Q1 2026 | Q4 2025 | Q3 2025 | Q2 2025 | Q1 2025 | ||||||||||
| Cost of sales | 151,698 | 146,919 | 134,664 | 120,592 | 122,783 | ||||||||||
| Less: | |||||||||||||||
| Depletion and amortization | (29,166 | ) | (27,207 | ) | (27,876 | ) | (25,210 | ) | (22,425 | ) | |||||
| Changes in inventories of finished goods | 19,875 | (2,611 | ) | 1,425 | 2,123 | (2,710 | ) | ||||||||
| Changes in inventories of ore stockpiles | (1,332 | ) | 13,473 | 16,685 | (5,718 | ) | (22,747 | ) | |||||||
| Changes in inventories of copper in solutions | 2,290 | - | - | - | - | ||||||||||
| Transportation costs | (6,395 | ) | (10,989 | ) | (7,247 | ) | (5,720 | ) | (5,984 | ) | |||||
| Site operating costs | 136,970 | 119,585 | 117,651 | 86,067 | 68,917 | ||||||||||
| Less: Florence site operating costs | (9,949 | ) | - | - | - | - | |||||||||
| Gibraltar site operating costs | 127,021 | 119,585 | 117,651 | 86,067 | 68,917 | ||||||||||
| Less by-product credits: | |||||||||||||||
| Molybdenum, net of treatment costs | (27,009 | ) | (25,095 | ) | (13,903 | ) | (4,814 | ) | (8,774 | ) | |||||
| Silver, excluding amortization of deferred revenue | 2,026 | 312 | (295 | ) | (58 | ) | (131 | ) | |||||||
| Gold | (567 | ) | (619 | ) | (761 | ) | (351 | ) | (389 | ) | |||||
| Gibraltar site operating costs, net of by-product credits | 101,471 | 94,183 | 102,692 | 80,844 | 59,623 | ||||||||||
| Gibraltar total copper produced (thousand pounds) | 29,893 | 30,712 | 27,593 | 19,813 | 19,959 | ||||||||||
| Total costs per pound produced | 3.39 | 3.07 | 3.72 | 4.08 | 2.99 | ||||||||||
| Average exchange rate for the period (CAD/USD) | 1.37 | 1.39 | 1.38 | 1.38 | 1.44 | ||||||||||
| Site operating costs, net of by-product credits (US$ per pound) |
2.47 | 2.21 | 2.70 | 2.96 | 2.08 | ||||||||||
| Gibraltar site operating costs, net of by-product credits | 101,471 | 94,183 | 102,692 | 80,844 | 59,623 | ||||||||||
| Add off-property costs: | |||||||||||||||
| Treatment and refining costs (premiums) | 96 | 394 | (512 | ) | (837 | ) | (510 | ) | |||||||
| Transportation costs | 6,395 | 10,989 | 7,247 | 5,720 | 5,984 | ||||||||||
| Gibraltar total operating costs | 107,962 | 105,566 | 109,427 | 85,727 | 65,097 | ||||||||||
| Gibraltar total operating costs (C1) (US$ per pound) | $ | 2.63 | $ | 2.47 | $ | 2.87 | $ | 3.14 | $ | 2.26 | |||||
Non-GAAP Performance Measures - continued
Gibraltar total site costs
Gibraltar total site costs include site operating costs charged to cost of sales and mining costs capitalized to property, plant and equipment in the period. This measure is intended to capture total site operating costs incurred at Gibraltar during the period calculated on a consistent basis for the periods presented.
|
Gibraltar (Cdn$ in thousands) |
Q1 2026 | Q4 2025 | Q3 2025 | Q2 2025 | Q1 2025 | ||||||||||
| Site operating costs (included in cost of sales) | 136,970 | 119,585 | 117,651 | 86,067 | 68,917 | ||||||||||
| Less: Florence site operating costs | (9,949 | ) | - | - | - | - | |||||||||
| Gibraltar site operating costs | 127,021 | 119,585 | 117,651 | 86,067 | 68,917 | ||||||||||
| Gibraltar capitalized stripping costs | 15,169 | 5,986 | 6,106 | 30,765 | 38,082 | ||||||||||
| Total site costs | 142,190 | 125,571 | 123,757 | 116,832 | 106,999 | ||||||||||
Adjusted net income (loss) and Adjusted EPS
Adjusted net income (loss) removes the effect of the following transactions from net income (loss) as reported under IFRS Accounting Standards:
- Unrealized foreign currency gains and losses;
- Unrealized gains and losses on derivatives (including any reversals for prior periods);
- Other operating costs;
- Call premium on settlement of debt;
- Loss on settlement of debt, net of capitalized interest;
- Realized gain on sale of finished goods inventories;
- Realized gains on processing of ore stockpiles;
- Accretion on Florence royalty obligation;
- Accretion on Cariboo consideration payable;
- Tax effect of sale of non-controlling interest in New Prosperity; and
- Non-recurring other expenses for Cariboo acquisition.
Management believes that these transactions do not reflect the underlying operating performance of the Company’s core mining business and are not necessarily indicative of future operating results. Furthermore, unrealized gains and losses on derivative instruments, changes in the fair value of financial instruments, and unrealized foreign currency gains and losses are not necessarily reflective of the underlying operating results for the periods presented.
Adjusted earnings per share (“Adjusted EPS”) is Adjusted net income attributable to common shareholders of the Company divided by the weighted average number of common shares outstanding for the period.
Non-GAAP Performance Measures - continued
| (Cdn$ in thousands) | Q1 2026 | Q4 2025 | Q3 2025 | Q2 2025 | ||||||||
| Net income (loss) | 16,844 | 4,454 | (27,838 | ) | 21,868 | |||||||
| Unrealized foreign exchange loss (gain) | 12,171 | (9,000 | ) | 14,287 | (40,335 | ) | ||||||
| Unrealized (gain) loss and fair value adjustments on derivatives | (9,582 | ) | 37,676 | 14,977 | 9,489 | |||||||
| Accretion on Cariboo consideration payable | 1,261 | 4,048 | 4,041 | 4,484 | ||||||||
| Accretion on Florence royalty obligation | 6,294 | 18,415 | 6,991 | 6,201 | ||||||||
| Tax effect of sale of non-controlling interest in New Prosperity | - | - | - | (9,285 | ) | |||||||
| Estimated tax effect of adjustments | 547 | (14,068 | ) | (6,874 | ) | (5,447 | ) | |||||
| Adjusted net income (loss) | 27,535 | 41,525 | 5,584 | (13,025 | ) | |||||||
| Adjusted EPS | $ | 0.08 | $ | 0.11 | $ | 0.02 | $ | (0.04 | ) | |||
| (Cdn$ in thousands) | Q1 2025 | Q4 2024 | Q3 2024 | Q2 2024 | ||||||||
| Net loss | (28,560 | ) | (21,207 | ) | (180 | ) | (10,953 | ) | ||||
| Unrealized foreign exchange loss (gain) | 2,074 | 40,462 | (7,259 | ) | 5,408 | |||||||
| Unrealized (gain) loss and fair value adjustments on derivatives | 23,536 | (25,514 | ) | 1,821 | 10,033 | |||||||
| Accretion on Cariboo consideration payable | 664 | 4,543 | 9,423 | 8,399 | ||||||||
| Accretion on Florence royalty obligation | 2,571 | 3,682 | 3,703 | 2,132 | ||||||||
| Other operating costs | - | 4,132 | 4,098 | 10,435 | ||||||||
| Realized gain on sale of inventory1 | - | - | - | 3,768 | ||||||||
| Realized gain on processing of ore stockpiles2 | - | 1,905 | 3,266 | 4,056 | ||||||||
| Non-recurring other expenses related to Cariboo acquisition | - | - | - | 394 | ||||||||
| Call premium on settlement of debt | - | - | - | 9,571 | ||||||||
| Loss on settlement of debt, net of capitalized interest | - | - | - | 2,904 | ||||||||
| Estimated tax effect of adjustments | (7,228 | ) | 2,465 | (6,644 | ) | (15,644 | ) | |||||
| Adjusted net income (loss) | (6,943 | ) | 10,468 | 8,228 | 30,503 | |||||||
| Adjusted EPS | $ | (0.02 | ) | $ | 0.03 | $ | 0.03 | $ | 0.10 | |||
| ||||||||||||
Adjusted EBITDA
Adjusted earnings before interest, taxes, depreciation and amortization (“Adjusted EBITDA”) is presented as a supplemental measure of the Company’s performance and ability to service debt. Adjusted EBITDA is frequently used by securities analysts, investors and other interested parties in the evaluation of companies in the industry, many of which present adjusted EBITDA when reporting their results. Issuers of “high yield” securities also present adjusted EBITDA because investors, analysts and rating agencies considering it useful in measuring the ability of those issuers to meet debt service obligations.
Non-GAAP Performance Measures - continued
Adjusted EBITDA represents net income before interest, income taxes, depreciation and amortization, and also eliminates the impact of a number of transactions that are not considered indicative of ongoing operating performance. Certain items of expense are added back and certain items of income are deducted from net income that are not likely to recur or are not indicative of the Company’s underlying operating results for the reporting periods presented or for future operating performance and consist of:
- Unrealized foreign exchange gains and losses;
- Unrealized gains and losses on derivative (including any reversals for prior periods);
- Amortization of share-based compensation expense;
- Other operating costs;
- Call premium on settlement of debt;
- Loss on settlement of debt;
- Realized gains on sale of finished goods inventories;
- Realized gains on processing of ore stockpiles; and
- Non-recurring other expenses for Cariboo acquisition.
| (Cdn$ in thousands) | Q1 2026 | Q4 2025 | Q3 2025 | Q2 2025 | ||||
| Net income (loss) | 16,844 | 4,454 | (27,838 | ) | 21,868 | |||
| Depletion and amortization | 29,166 | 27,207 | 27,974 | 25,210 | ||||
| Finance and accretion expenses | 20,214 | 36,925 | 24,888 | 23,943 | ||||
| Finance income | (1,474 | ) | (1,098 | ) | (1,368 | ) | (124 | ) |
| Income tax expense (recovery) | 16,657 | 13,096 | 2,918 | (27,439 | ) | |||
| Unrealized foreign exchange loss (gain) | 12,171 | (9,000 | ) | 14,287 | (40,335 | ) | ||
| Unrealized (gain) loss on derivatives and fair value adjustments | (9,582 | ) | 37,676 | 14,977 | 9,489 | |||
| Share-based compensation expense | 9,467 | 7,204 | 6,299 | 4,820 | ||||
| Adjusted EBITDA | 93,463 | 116,464 | 62,137 | 17,432 | ||||
| (Cdn$ in thousands) | Q1 2025 | Q4 2024 | Q3 2024 | Q2 2024 | ||||
| Net loss | (28,560 | ) | (21,207 | ) | (180 | ) | (10,953 | ) |
| Depletion and amortization | 22,425 | 24,641 | 20,466 | 13,721 | ||||
| Finance and accretion expenses | 18,877 | 21,473 | 25,685 | 21,271 | ||||
| Finance income | (1,330 | ) | (1,674 | ) | (1,504 | ) | (911 | ) |
| Income tax expense (recovery) | (7,980 | ) | 11,707 | (200 | ) | (3,247 | ) | |
| Unrealized foreign exchange loss (gain) | 2,074 | 40,462 | (7,259 | ) | 5,408 | |||
| Unrealized (gain) loss on derivatives | 23,536 | (25,514 | ) | 1,821 | 10,033 | |||
| Share based compensation expense (recovery) | 5,349 | (323 | ) | 1,496 | 2,585 | |||
| Other operating costs | - | 4,132 | 4,098 | 10,435 | ||||
| Call premium on settlement of debt | - | - | - | 9,571 | ||||
| Loss on settlement of debt | - | - | - | 4,646 | ||||
| Realized gain on sale of inventory2 | - | - | - | 3,768 | ||||
| Realized gain on processing of ore stockpiles3 | - | 1,905 | 3,266 | 4,056 | ||||
| Non-recurring other expenses for Cariboo acquisition | - | - | - | 394 | ||||
| Adjusted EBITDA | 34,391 | 55,602 | 47,689 | 70,777 | ||||
Non-GAAP Performance Measures - continued
Earnings from mining operations before depletion, amortization and non-recurring items
Earnings from mining operations before depletion, amortization and non-recurring items is earnings from mining operations with depletion and amortization, and any items that are not considered indicative of ongoing operating performance added back. The Company discloses this measure, which has been derived from the Company’s financial statements and applied on a consistent basis, to assist in understanding the results of the Company’s operations and financial position, and it is meant to provide further information about the financial results to investors.
| Three months ended March 31, |
||
| (Cdn$ in thousands) | 2026 | 2025 |
| Earnings from mining operations | 84,443 | 16,366 |
| Add: | ||
| Depletion and amortization | 29,166 | 22,425 |
| Other operating costs | 952 | - |
| Earnings from mining operations before depletion, amortization and non-recurring items | 114,561 | 38,791 |
Gibraltar site operating costs per ton milled
The Company discloses this measure, which has been derived from the Company’s financial statements and applied on a consistent basis, to assist in understanding the Company’s Gibraltar site operations on a tons milled basis.
|
Gibraltar (Cdn$ in thousands) |
Q1 2026 | Q4 2025 | Q3 2025 | Q2 2025 | Q1 2025 | ||||||
| Site operating costs (included in cost of sales) | 136,970 | 119,585 | 117,651 | 86,067 | 68,917 | ||||||
| Less: Florence site operating costs | (9,949 | ) | - | - | - | - | |||||
| Gibraltar site operating costs | 127,021 | 119,585 | 117,651 | 86,067 | 68,917 | ||||||
| Gibraltar tons milled (thousand tons) | 7,000 | 7,200 | 7,852 | 7,663 | 7,898 | ||||||
| Site operating costs per ton milled | $ | 18.15 | $ | 16.61 | $ | 14.98 | $ | 11.23 | $ | 8.73 | |
Technical Information
The technical information contained in this MD&A related to Florence Copper is based on the report titled “NI 43-101 Technical Report - Florence Copper Project, Pinal County, Arizona” issued on March 30, 2023 with an effective date of March 15, 2023 (the “Florence 2023 Technical Report”), which is available on SEDAR+. The Florence 2023 Technical Report was prepared under the supervision of Richard Tremblay, P. Eng., MBA, Richard Weymark, P. Eng., MBA, and Robert Rotzinger, P. Eng. Mr. Tremblay is employed by the Company as Chief Operating Officer, Mr. Weymark is employed by the Company as Vice President, Engineering, and Mr. Rotzinger is employed by the Company as Vice President, Capital Projects. All three are Qualified Persons as defined by NI 43-101.
The technical information contained in this MD&A related to Yellowhead is based on the report titled “Technical Report Update on the Yellowhead Copper Project, British Columbia, Canada” issued on July 10, 2025 with an effective date of June 15, 2025 (the “Yellowhead 2025 Technical Report”), which is available on SEDAR+. The Yellowhead 2025 Technical Report was prepared under the supervision of Richard Weymark, P. Eng., MBA, Jeremy Guichon, P. Eng., and Adil Cheema, P. Eng. Mr. Weymark is employed by the Company as Vice President, Engineering, Mr. Guichon is employed by the Company as Director, Mine Engineering, and Mr. Cheema is employed by the Company as Director, Process Engineering. All three are Qualified Persons as defined by NI 43-101.
No regulatory authority has approved or disapproved of the information contained in this news release
Caution Regarding Forward-Looking Information
This document contains “forward-looking statements” that were based on Taseko’s expectations, estimates and projections as of the dates as of which those statements were made. Generally, these forward-looking statements can be identified by the use of forward-looking terminology such as “outlook”, “anticipate”, “project”, “target”, “believe”, “estimate”, “expect”, “intend”, “should” and similar expressions.
Forward-looking statements are subject to known and unknown risks, uncertainties and other factors that may cause the Company’s actual results, level of activity, performance or achievements to be materially different from those expressed or implied by such forward-looking statements. These included but are not limited to:
- uncertainties about the future market price of copper and the other metals that we produce or may seek to produce;
- changes in general economic conditions, the financial markets and in the market price for our input costs including due to inflationary impacts, such as diesel fuel, acid, steel, concrete, electricity and other forms of energy, mining equipment, and fluctuations in exchange rates, particularly with respect to the value of the U.S. dollar and Canadian dollar, and the continued availability of capital and financing;
- inherent risks associated with mining operations, including our current mining operations at Gibraltar and Florence Copper, and their potential impact on our ability to achieve our production estimates;
- our high level of indebtedness and its potential impact on our financial condition and the requirement to generate cash flow to service our indebtedness and refinance such indebtedness from time to time;
- any increases in interest rates may increase our borrowing costs and impact the profitability of our operations;
- the amounts we are required to pay for our acquisition of Cariboo will increase with higher copper prices;
- the risk of inadequate insurance or inability to obtain insurance to cover our business risks;
- uncertainties related to the accuracy of our estimates of Mineral Reserves (as defined below), Mineral Resources (as defined below), production rates and timing of production, future production and future cash and total costs of production and milling;
- the risk that we may not be able to expand or replace Mineral Reserves as our existing Mineral Reserves are mined;
- the risk that the ramp-up of the Florence Copper commercial production facility does not proceed within projected timelines or cost estimates, or that initial operations do not achieve results consistent with the projections in the Florence Copper Technical Report, including with respect to operating costs, revenue, sustaining capital, rates of return and cash flows from operations;
- our ability to comply with all conditions imposed under the APP and UIC permits for the operation of Florence Copper;
- the availability of, and uncertainties relating to, any additional financing necessary for the continued ramp-up and commercial operation of Florence Copper, including with respect to our ability to obtain any additional financing, if needed, to continue and expand commercial operations at Florence Copper;
- shortages of water supply, critical spare parts, acid, diesel, maintenance service and new equipment and machinery or our ability to manage surplus water on our mine sites may materially and adversely affect our operations and development projects;
- our ability to comply with the extensive governmental regulation to which our business is subject;
- uncertainties related to our ability to obtain necessary title, licenses and permits for our development projects and project delays due to third party opposition;
- uncertainties related to Indigenous people’s claims and rights, and legislation and government policies regarding the same;
- our reliance on the availability of infrastructure necessary for development and on operations, including on rail transportation and port terminals for shipping of our copper concentrate production from Gibraltar, and rail transportation and power for the feasibility of our other British Columbia development projects;
- uncertainties related to unexpected judicial or regulatory proceedings;
- changes in, and the effects of, the laws, regulations and government policies affecting our exploration and development activities and mining operations;
- potential changes to the mineral tenure system in British Columbia, which is undergoing reform including for compliance with the British Columbia Declaration on the Rights of Indigenous Peoples Act (“DRIPA”);
- our dependence solely on our 100% interest in Gibraltar and in due course, Florence Copper for our revenues and our operating cash flows;
- our ability to extend existing concentrate off-take agreements and cathode purchase agreements or enter into new agreements;
- environmental issues and liabilities associated with mining including processing and stockpiling ore;
- labour strikes, work stoppages, or other interruptions to, or difficulties in, the employment of labour in markets in which we operate mines, industrial accidents, equipment failure or other events or occurrences, including third party interference that interrupt the production of minerals in our mines;
- environmental hazards and risks associated with climate change, including the potential for damage to infrastructure and stoppages of operations due to extreme cold, extreme heat, forest fires, flooding, drought, earthquakes or other natural events in the vicinity of our operations;
- litigation risks and the inherent uncertainty of litigation;
- our actual costs of reclamation and mine closure may exceed our current estimates of these liabilities;
- our ability to renegotiate our existing union agreement for Gibraltar when it expires in May 2027;
- the capital intensive nature of our business both to sustain current mining operations and to develop any new projects;
- our ability to develop new mining projects in British Columbia may be impacted by joint decision-making and consent agreements being implemented by the Government of British Columbia with First Nations under DRIPA;
- The ability to develop the New Prosperity Project is subject to the restrictions set out in our June 2025 Tripartite Agreement with the Province of British Columbia and the Tŝilhqot’in Nation (the “Teẑtan Biny Agreement”), under which the New Prosperity Project is subject to a land use planning process with the Province of British Columbia and we are not permitted to be the proponent of any development of the New Prosperity Project;
- our reliance upon key personnel;
- the competitive environment in which we operate;
- the effects of forward selling instruments to protect against fluctuations in copper prices and other input costs including diesel and acid;
- the risk of changes in accounting policies and methods we use to report our financial condition, including uncertainties associated with critical accounting assumptions and estimates;
- uncertainties relating to the war in Ukraine, the escalating military conflict involving Iran and broader Middle East instability, and other future geopolitical events including social unrest, which could disrupt financial markets, commodity markets, supply chains, the price and availability of energy, availability of materials and equipment and execution timelines for any project development;
- uncertainties relating to the delivery of oil through the Strait of Hormuz resulting from Middle East instability, which could have an adverse effect on global economic activity and potentially
- increase operating costs generally and reduce global demand for copper, and have a material adverse effect on our business, operations, and the feasibility of our development projects;
- changes to U.S. trade policies and tariff measures, including retaliatory tariffs imposed or threatened by Canada and other trading partners, may adversely impact overall economic conditions, copper markets, supply chains, metal prices and input costs; and
- other risks detailed from time-to-time in our annual information forms, annual reports, MD&A, quarterly reports and material change reports filed with and furnished to securities regulators, and those risks which are discussed under the heading “Risk Factors”.
For further information on Taseko, investors should review the Company’s annual report on Form 40-F filed with the United States Securities and Exchange Commission and available at www.sec.gov and home jurisdiction filings that are available at www.sedarplus.ca.
Photos accompanying this announcement are available at
https://www.globenewswire.com/NewsRoom/AttachmentNg/1337acab-c25e-4bd8-b99c-1a6d6a7f69c8
https://www.globenewswire.com/NewsRoom/AttachmentNg/d41a337d-01fc-45c9-a51c-e242ef658aef

![]()
Florence Copper Wellfield
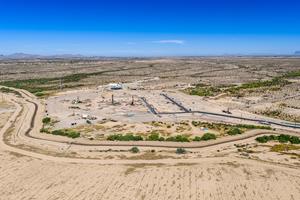
Florence Copper Wellfield, May 2026
Total Operating Costs (C1)* (US$ per pound of copper produced)
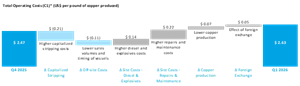
Total Operating Costs (C1)* (US$ per pound of copper produced)
Legal Disclaimer:
EIN Presswire provides this news content "as is" without warranty of any kind. We do not accept any responsibility or liability for the accuracy, content, images, videos, licenses, completeness, legality, or reliability of the information contained in this article. If you have any complaints or copyright issues related to this article, kindly contact the author above.
